Type 2 Diabetes Mellitus
Treatment options:
Weight loss, though challenging to achieve, is a powerful intervention for type 2 diabetes.
Metabolic benefits of weight loss in T2DM
more
Weight loss of ≥5% of body weight is associated with:
- a reduction in HbA1c of 10mmol/mol (0.9%)
- a reduction in LDL cholesterol of 0.12mmol/L
- an increase in HDL cholesterol of 0.1mmol/L
- a reduction in systolic BP of 5mmHg
Low carbohydrate v low fat v other macronutrient diets
more
In RCTs, the type of diet being followed does not appear to make a difference to weight loss at 6 months.
Adherence to diet is a greater predictor of weight loss – the best diet is one that someone can stick to.
Newer dietary approaches and diabetes remission – what is possible
more
The finding that diabetes can actually be cured with enough sustained weight loss is a new and potent idea supported by various studies over the last several years. Though generalisation of these studies is limited by the context, what individuals are able to achieve, and what support is available to them, they offer an exciting alternative to long-term medicalisation.
Two examples are:
An RCT comparing a structured intervention based around a total diet replacement (liquid formula diet) v usual care for 12-20 weeks in patients with T2DM of up to 6 years’ duration:
- 46% of patients in the intervention group were in diabetes remission at 1 year, and 36% at 2 years
- 24% of patients in the usual care group were in diabetes remission at 1 year, and 3% at 2 years
A single UK GP practice adopted an innovative low-carbohydrate approach to their management of T2DM. They report that, in those patients who accepted the offer of this approach (39% of those eligible), they observed:
- mean weight loss 10kg
- mean reduction in HcA1c 21mmol/mol (6%)
- 51% of the cohort achieved remission of diabetes
- 77% of those who had been diagnosed within the last year achieved remission
- remission was more likely with shorter duration of diabetes and lower starting HbA1c
- approx 1/3 of these patients were newly diagnosed
A description of their strategy is given in this paper, with copies of the practice protocols and materials.
Bariatric surgery
more
Bariatric surgery for those with a BMI >30kg/m2 has been shown to result in greater initial weight loss than non-surgical methods:
- 30-62% of patients achieve remission of diabetes after surgery
- 80% of those who lose >15 kilos achieve remission
- late weight regain is common, with relapse in 35-50% of patients who achieve remission
Evidence Source: Various
Figures on metabolic benefits of weight loss are derived from a systematic review of RCTs of dietary interventions1:
- 2 trials achieved weight loss ≥5%, including 2678 patients
Figures on low-carbohydrate v low-fat diets are derived from a 2014 systematic review of RCTs2:
- 48 trials involving 7286 patients
Figures for diabetes remission interventions are derived from:
- a 2018 RCT involving 298 patients3
- a UK single-practice primary care cohort of 186 patients4
Figures for bariatric surgery are derived from a national guideline summary5.
References
1)Franz M, Boucher J, Rutten-Ramos S et al. Lifestyle Weight-Loss Intervention Outcomes in Overweight and Obese Adults with Type 2 Diabetes: A Systematic Review and Meta-Analysis of Randomized Clinical Trials. Journal of the Academy of Nutrition and Dietetics 2015; 115(9); 1447-1463
2)Johnston BC, Kanters S, Bandayrel K et al. Comparison of weight loss among named diet programs in overweight and obese adults: a meta-analysis. JAMA 2014; 312(9): 923-33
3)Lean M, Leslie W, Barnes AC et al. Durability of a primary care-led weight-management intervention for remission of type 2 diabetes: 2-year results of the DiRECT open-label, cluster-randomised trial. Lancet Diabetes Endocrinol 2019; 7(5): 344-355
4) et al. What predicts drug-free type 2 diabetes remission? Insights from an 8-year general practice service evaluation of a lower carbohydrate diet with weight loss.
5)Diabetes UK nutrition working group. Evidence-based nutrition guidelines for the prevention and management of diabetes. [Internet] 2018
Cardiovascular events are the commonest complication of type 2 diabetes.
Treating hypertension and/or prescribing statins are among the most effective drug interventions in diabetes management.
- In most cases, these will deliver a greater cardiovascular risk reduction than glucose lowering drugs.
NICE recommends standard BP and cholesterol targets for primary prevention in people with T2DM.
An individual’s benefit will depend on their baseline cardiovascular risk (with a diagnosis of diabetes included in that risk calculation).
- Follow the links below for infographics showing treatment benefits based on QRISK scores.
Lower BP targets in T2DM
A 2019 NICE evidence review1 and a 2013 Cochrane review2 both concluded that there was not enough evidence to recommend lower BP targets for patients with hypertension and diabetes.
Both acknowledged the ACCORD study3 which showed:
- 1% absolute risk reduction in stroke by aiming for a systolic BP target of 120mmHg
- no difference in overall cardiovascular events
- 2% absolute risk increase in serious adverse events*
*events resulting in hospital admission, death, near-death or persisting disability
References
1)Hypertension in adults: diagnosis and management [D] Evidence review for targets 2019 NICE guideline NG136
2)Arguedas JA, Leiva V, Wright JM. Blood pressure targets for hypertension in people with diabetes mellitus. Cochrane Database of Systematic Reviews 2013, Issue 10. Art. No.: CD008277. DOI: 10.1002/14651858
3)ACCORD study group. Effects of Intensive Blood-Pressure Control in Type 2 Diabetes Mellitus. N Engl J Med 2010; 362: 1575-1585
BP and microvascular outcomes
BP control has also been shown to reduce rates of microvascular complications1:
- 1.5% ARR in total microvascular complications among a variety of trials running up to 10 years
- NNT 45 over 10 years to prevent one retinopathy event
- NNT 11 over 10 years to prevent one new case of albuminuria
MODERATE quality evidence
- large numbers of RCTs at low risk of bias
- but not all results statistically significant
| This research provides a good indication of the treatment effect.
There is a moderate possibility that the true effect is smaller or greater. |
Reference
1)Emdin CA, Rahimi K, Neal B et al. Blood Pressure Lowering in Type 2 Diabetes: A Systematic Review and Meta-analysis. JAMA 2015; 313(6): 603–615
ACE inhibitors and ARBs reduce progression to end-stage renal disease in patients with CKD and albuminuria.
There is no evidence for this benefit in patients with CKD without albuminuria, even if they have T2DM.
NICE recommends offering them to those with diabetes if they have:
- a urine ACR >3mg/mmol
- higher levels of ACR apply for those without diabetes
They have not been shown to reduce cardiovascular events or overall mortality (outside of their role treating any co-morbidities such as hypertension or heart failure).
| Metformin | HbA1c reduction | Weight | Hypo risk |
| Average/approximate effect: | 11-22mmols/mol (1-2%) | None | No |
NICE recommends metformin as a first-line drug treatment.
Our understanding of its effect comes from one major trial (UKPDS 34), which compared diet alone to diet plus metformin over 10 years. It showed:
- benefit on cardiovascular endpoints
- no benefit on microvascular endpoints
Average achieved HbA1c in diet-only group: 64 mmol/mol (8.0%)
Average achieved HbA1c in treatment group: 57 mmol/mol (7.4%)
If 100 people with newly diagnosed diabetes take metformin for 10 years, 6.4 will avoid an MI compared to those who do not take metformin
If 100 people with newly diagnosed diabetes take metformin for 10 years, 7 will avoid death compared to those who do not take metformin
Evidence Source: single study
Figures derived from the UKPDS 34 trial1.
- involved 753 patients with newly diagnosed diabetes
- compared diet plus metformin with diet alone
- followed up for a median of 10.7 years
- conducted during 1980s-1990s
Reference
1)Effect of intensive blood-glucose control with metformin on complications in overweight patients with type 2 diabetes (UKPDS 34). Lancet 1998; 352(9131): 854-865
Evidence Quality: LOW
| This research provides some indication of the treatment effect.
There is a high possibility that the true effect is smaller or greater. |
Though this was a large, well conducted RCT1, there is some risk of bias:
- non-blinding of participants to treatment
- imprecise estimates of effect size (small numbers of events, wide confidence intervals)
Reference
1)Effect of intensive blood-glucose control with metformin on complications in overweight patients with type 2 diabetes (UKPDS 34). Lancet 1998; 352(9131): 854-865
Study Population
The population characteristics in the UKPDS 34 trial1 were:
- mean age 53 years
- 54% female
- ethnicity: 86% Caucasian, Indian Asian 5%, Afro-Caribbean 8%, other 1%
- BMI 31.6
- SBP 140mmHg
- 57% smokers or ex-smokers
- HbA1c at start of study 7.3%
- TC/HDL ratio 5.3
- creatinine 77mmol/L
Reference
1)Effect of intensive blood-glucose control with metformin on complications in overweight patients with type 2 diabetes (UKPDS 34). Lancet 1998; 352(9131): 854-865
Effect on microvascular outcomes
Metformin has not been conclusively shown to reduce microvascular endpoints. However, you may have heard that it does.
This assertion probably comes from the data on microvascular outcomes in the UKPDS 34 trial1.
This showed a 2.2% absolute risk reduction in “combined microvascular end-points” after 10 years of metformin treatment.
However, none of the microvascular outcomes (including the combined end-point outcome) were statistically significant.
The table below shows that most of the reduction in microvascular events comes from retinal photocoagulation events (the most common microvascular endpoint).
Small increases in blindness in one eye and renal failure may be chance findings.
| Diet only | Metformin+diet | |
| Retinal photocoagulation | 8.8% | 6.4% |
| Blindness in 1 eye | 3.2% | 3.5% |
| Renal failure | 0.5% | 0.6% |
| Amputation (single toe or more) | 2.2% | 1.8% |
| “Combined microvascular endpoints” (photocoagulation+vitreous haemorrhage+renal failure) | 10% | 7.6% |
Were this trial to have continued with full randomisation for another 10 years, some of these differences may have become statistically significant, but it is impossible to know for sure.
Reference
1)Effect of intensive blood-glucose control with metformin on complications in overweight patients with type 2 diabetes (UKPDS 34). Lancet 1998; 352(9131): 854-865
Other metformin studies
Is UKPDS 34 really the only study on metformin? It seems hard to believe that such an established drug has such a small evidence base.
Two systematic reviews on metformin treatment found 13 trials each, though all except UKPDS were too small or too short to give information on important clinical endpoints1,2.
UKPDS 34 contained another arm which:
- compared metformin+sulphonylurea to sulphonylurea alone
- no additional benefit in adding metformin
- cardiovascular mortality increased (from 4.8% to 11.2%) in the combination group
- though statistically significant, this result has generally been interpreted as a chance finding
- a number of randomised and observational studies have not replicated this finding1
The consensus in diabetes guidelines around the world is that metformin is still a first choice as monotherapy.
The role of sulphonylureas as add-on therapy may be diminishing due to newer drugs with evidence of better outcomes.
References
1)Boussageon R, Supper I, Bejan-Angoulvant T et al. Reappraisal of Metformin Efficacy in the Treatment of Type 2 Diabetes: A Meta-Analysis of Randomised Controlled Trials. PLoS Med 2012; 9(4): e1001204
2)Griffin SJ, Leaver JK, Irving GJ. Impact of metformin on cardiovascular disease: a meta-analysis of randomised trials among people with type 2 diabetes. Diabetologia 2017; 60: 1620–1629
GI side effects
Up to 1 in 4 people will experience diarrhoea, nausea or vomiting. This risk can be much reduced with careful dose titration.
Lactic acidosis
<10 per 100,000 patient years2
Lactic acidosis is a serious condition, with a mortality rate of 30-50%3.
more
Metformin-related lactic acidosis is triggered by renal impairment, from dehydration or systemic illness.
- more likely in the context of pre-existing renal impairment or other drugs which impair renal function
- this risk may be mitigated by pausing metformin (“sick day rules”) when dehydration is a risk
BNF recommends not to prescribe if eGFR <30 mL/minute/1.73 m2.
B12 deficiency
2 – 7% of people develop vitamin B12 deficiency due to metformin.
more
Estimates of how likely this is vary – two examples are given below:
| B12 deficiency in placebo group | B12 deficiency in metformin group | Notes | |
| 2010
RCT in Netherlands4 |
2.7% | 9.9% | Deficiency defined as serum B12 level <150pmol/mL
Falls in B12 were seen within the first 1-2 years of treatment |
| 2016
RCT in USA5 |
2.3% | 4.3% | Deficiency defined as serum B12 level <203pmol/mL
Small and/or non-statistically significant differences in peripheral neuropathy and anaemia were observed |
An MHRA safety update in 2022 said:
- ‘Consider decreased vitamin B12 levels to be a common side effect of metformin therapy.
- Risk factors increasing the likelihood of B12 deficiency are:
- Gastrointestinal conditions which may affect B12 absorption
- Vegan or some vegetarian diets
- Concomitant PPI or colchicine treatment’
References
1) . Understanding and overcoming metformin gastrointestinal intolerance. Diabetes Obes Metab 2017; 19: 473–481
2)DeFronzo R, Fleming GA, Chen K, Bicsak TA. Metformin-associated lactic acidosis: Current perspectives on causes and risk. Metabolism 2016; 65(2): 20-29
3) Metformin associated lactic acidosis
4) Long term treatment with metformin in patients with type 2 diabetes and risk of vitamin B-12 deficiency: randomised placebo controlled trial
5)Aroda VR, Edelstein SL, Goldberg RB et al. Long-term Metformin Use and Vitamin B12 Deficiency in the Diabetes Prevention Program Outcomes Study. J Clin Endocrinol Metab 2016; 101(4): 1754-1761
| SGLT2 inhibitors | HbA1c reduction | Weight | Hypo risk |
| Average/approximate effect: | 5-11 mmol/mol (0.5-1%) | 3-4 lb loss | Very low |
NICE recommends:
- offering an SGLT2i to those with T2DM and pre-existing CVD
- consider (think about) an SGLT2i for those with T2DM and a high cardiovascular risk (they suggest QRISK >10%)
This would commonly be as a second line addition to metformin treatment, but may also be as a single agent where metformin is not tolerated, or as part of combination treatment with other hypoglycaemic drugs.
|
For patients with co-existing CKD or heart failure, the evidence is different. See the separate sections linked below. |
In the data below:
- the “primary prevention” population had a baseline 10-year cardiovascular risk of approximately 30%
- “renal outcomes” means: 40% or more reduction in eGFR or end-stage renal disease or renal death.
If 100 people take an SGLT2i for 4 years, 0.7 will avoid a hospitalisation for heart failure compared with those who do not take an SGLT2i
If 100 people take an SGLT2i for 4 years, 1.2 will avoid a renal outcome compared with those who do not take an SGLT2i
No difference in MI or stroke was observed in this population after 4 years taking an SGLT2i
No difference in total mortality was observed in this population after 4 years taking an SGLT2i
If 100 people take an SGLT2i for 4 years, 1.2 will avoid a hospitalisation for heart failure compared with those who do not take an SGLT2i
If 100 people take an SGLT2i for 4 years, 1.5 will avoid a renal outcome compared with those who do not take an SGLT2i
If 100 people take an SGLT2i for 4 years, 1.2 will avoid an MI compared with those who do not take an SGLT2i
No difference in stroke risk was observed in this population after 4 years taking an SGLT2i
If 100 people take an SGLT2i for 4 years, 0.8 will avoid death compared with those who do not take an SGLT2i
Evidence Source: various
Figures derived from one key RCT (DECLARE-TIMI)1. We reviewed this alongside 3 recent meta-analyses, including one from NICE in 20222,3,4:
- the meta-analyses reach broadly similar conclusions
- we have selected DECLARE-TIMI to present as none of the meta-analyses published figures which could be used in our format
The NICE review involved 4 RCTs studying a range of SGLT2is and involving 42,568 patients.
DECLARE-TIMI
- involved 17,160 patients from 33 countries
- compared dapagliflozin 10mg daily with placebo in addition to their usual management
- follow up 4.2 years
- analysed as two separate groups
- with pre-existing cardiovascular disease
- without pre-existing cardiovascular disease
- those with eGFR <60ml/min/1.73m2 were excluded at recruitment
- 10% of patients had a heart failure diagnosis at the outset
Data detail
Outcome data for MI and total mortality did not reach statistical significance in the DECLARE-TIMI trial, but did achieve this in meta-analysis so have been included here.
References
1)DECLARE–TIMI 58 Investigators. Dapagliflozin and Cardiovascular Outcomes in Type 2 Diabetes. N Engl J Med 2019; 380: 347-357
2)Palmer SC, Tendal B, Mustafa RA et al. Sodium-glucose cotransporter protein-2 (SGLT-2) inhibitors and glucagon-like peptide-1 (GLP-1) receptor agonists for type 2 diabetes: systematic review and network meta-analysis of randomised controlled trials. BMJ 2021; 372 :m4573
3)McGuire DK, Shih WJ, Cosentino F et al. Association of SGLT2 Inhibitors With Cardiovascular and Kidney Outcomes in Patients With Type 2 Diabetes: A Meta-analysis. JAMA Cardiol 2021; 6(2): 148-158
4) National Institute for Health and Care Excellence. Evidence review (B) underpinning recommendations 1.7.4-1.7.6 and 1.7.9-1.7.15 in: Type 2 diabetes Pharmacological therapies with cardiovascular and other benefits in people with type 2 diabetes. NICE; 2022 (NICE guideline [NG28])
Evidence Quality: HIGH
| This research provides a very good indication of the treatment effect.
However, it is possible that the true effect is slightly smaller or greater. |
NICE rated this evidence as HIGH quality after network meta-analysis1:
- large RCTs at low risk of bias
- statistically significant results (mostly) with reasonable confidence intervals
- applicable to the target population
Note: the effect of SGLT2is on cardiovascular and total mortality may be under-represented in the DECLARE-TIMI trial – see the separate button below for details.
Reference
1)National Institute for Health and Care Excellence. Evidence review (B) underpinning recommendations 1.7.4-1.7.6 and 1.7.9-1.7.15 in: Type 2 diabetes Pharmacological therapies with cardiovascular and other benefits in people with type 2 diabetes. NICE; 2022 (NICE guideline [NG28])
Study Population
The population characteristics in the DECLARE-TIMI trial1 were:
- mean age 64
- 38% female
- ethnicity: 80% White, 3.5% Black, 13.5% Asian, 3.6% other.
- mean duration of T2DM: 10 years
- 40% established CVD, 60% primary prevention with CV risk factors
- 10% with heart failure
- eGFR 85ml/min/1.73m2
- BP 135/85 mmHg
- HbA1c at outset: 67 mmol/mol (8.3%)
- metformin 81%
- sulfonylurea 42%
- insulin 41%
- DPP-4 17%
- GLP-1 4%
Reference
1)DECLARE–TIMI 58 Investigators. Dapagliflozin and Cardiovascular Outcomes in Type 2 Diabetes. N Engl J Med 2019; 380: 347-357
Mortality reduction with SGLT2i treatment
|
Note: for patients with established CKD or heart failure see separate sections linked below. |
The DECLARE-TIMI trial results as shown above may underrepresent the benefits of SGLT2is on total mortality in those with established CVD.
Another trial, EMPA-REG2, which recruited patients all with pre-existing CVD and T2DM, showed a larger and statistically significant benefit.
Meta-analysis produces an estimate of benefit somewhere in the middle.
| EMPA-REG* Patients with pre-existing CVD | ||||
| Placebo | Empagliflozin | ARR | NNT | |
| Cardiovascular mortality | 5.9% | 3.7% | 2.2% | 45 |
| Total mortality | 8.3% | 5.7% | 2.6% | 39 |
* EMPA-REG compared empagliflozin+usual care with placebo+usual care
-
7028 patients
-
3 year follow up
-
all patients with pre-existing CVD but otherwise a broadly similar population to DECLARE-TIMI trial
References
1)McGuire DK, Shih WJ, Cosentino F et al. Association of SGLT2 Inhibitors With Cardiovascular and Kidney Outcomes in Patients With Type 2 Diabetes: A Meta-analysis. JAMA Cardiol 2021; 6(2): 148–158
2)EMPA-REG OUTCOME Investigators. Empagliflozin, Cardiovascular Outcomes, and Mortality in Type 2 Diabetes. N Engl J Med 2015; 373: 2117-2128
Which SGLT2i?
The NICE evidence review1 concluded there were no statistically or clinically meaningful differences to recommend one SGLT2i over the other
- even though some trials on individual drugs do show some differences regarding particular outcomes.
Reference
1)National Institute for Health and Care Excellence. Evidence review (B) underpinning recommendations 1.7.4-1.7.6 and 1.7.9-1.7.15 in: Type 2 diabetes Pharmacological therapies with cardiovascular and other benefits in people with type 2 diabetes. NICE; 2022 (NICE guideline [NG28])
Polyuria, thirst, lightheadedness
1 in 10 – 100 people.
Source: BNF
SGLT2 inhibitors work by increasing glucose excretion in the urine.
More
Absolute risk data is not available, but the BNF lists these as “common or very common” (up to 1 in 10 – 100)
Genital infections (mainly candidiasis)
3 in every 100 people will develop this due to treatment.
More
Diabetes is a risk factor for this in itself.
In a Cochrane review1, 1.6% of people with diabetes taking placebo developed this compared with 4.6% of people taking an SGLT2i
- MODERATE quality evidence
Urinary tract infections
No increase in UTIs was seen due to treatment with SGLT2 inhibitors in the RCTs1.
Hypoglycaemia
In RCTs, there was no increase in hypoglycaemia seen with SGLT2i compared with placebo1,2.
- MODERATE quality evidence.
This may occur in combination with insulin or sulfonylurea (up to 1 in 10 – 100) according to the BNF.
Diabetic ketoacidosis
May occur as a side effect in up to 1 in 1000 – 10,000 people, usually within the first 2 months of treatment3.
May present with only mildly elevated blood glucose.
More
A suggestion of an increased risk of DKA is seen in the meta-analysis of RCTs1,2, but not to a level of statistical significance.
This estimate of frequency comes from post-marketing surveillance data.
The causal mechanism is unknown.
The MHRA recommend caution and vigilance in the context of:
- acute severe illness
- sudden changes to insulin dosing
- restricted food intake or dehydration
- alcohol abuse
and to
- test for ketones if there are systemic symptoms suggestive of DKA even with near-normal blood glucose.
Lower limb amputations (mainly toes)
An excess of 2 – 4 cases per 1000 (depending on dose) was seen in only one clinical trial (of canafliglozin).
Though there is no evidence of this risk being associated with other drugs in the class, the MHRA issued a warning for ‘the potential increased risk of lower-limb amputation, mostly affecting the toes’ for all SGLT2i4.
Fournier’s Gangrene
It is uncertain if this severe condition is caused by SGLT2i, but case reports triggered a safety warning:
- 6 case reports in the UK by January 2019 in the context of 548,565 patient-years of treatment5
More
This is a bacterial infection of the perineum which can be rapidly progressive and cause abscesses and necrotising fasciitis.
Diabetes is a risk factor in itself.
The MHRA advise patients to seek urgent medical attention if they experience severe pain, tenderness, erythema, or swelling in the genital or perineal area, accompanied by fever or malaise.
If suspected, it requires immediate referral to secondary care.
References
1)Lo C, Toyama T, Wang Y et al. Insulin and glucose‐lowering agents for treating people with diabetes and chronic kidney disease. Cochrane Database of Systematic Reviews 2018, Issue 9. Art. No.: CD011798
2), , et al. Effect of SGLT2 inhibitors on cardiovascular, renal and safety outcomes in patients with type 2 diabetes mellitus and chronic kidney disease: A systematic review and meta-analysis. Diabetes Obes Metab 2019; 21: 1237–1250.
3)MHRA. SGLT2 inhibitors: updated advice on the risk of diabetic ketoacidosis. Drug Safety Update, 18 April 2016. Accessed online July 2021
4)MHRA. SGLT2 inhibitors: updated advice on increased risk of lower-limb amputation (mainly toes). Drug Safety Update, 22 March 2017. Accessed online July 2021
5)MHRA. SGLT2 inhibitors: reports of Fournier’s gangrene (necrotising fasciitis of the genitalia or perineum). Drug Safety Update, 18 Feb 2019. Accessed online July 2021
| GLP-1s | HbA1c reduction | Weight | Hypo risk |
| Average/approximate effect: | 5-11mmol/mol (0.5% – 1%) | 3-6lb loss | Very low |
GLP-1s are positioned in NICE guidance as an option to consider for glycaemic control after metformin and SGLT2is.
They reduce cardiovascular and all-cause mortality in patients with T2DM and pre-existing cardiovascular disease.
- This has not been shown in the population with T2DM without pre-existing cardiovascular disease.
If 100 people take a GLP-1 for 2 years, 0.5 will avoid a cardiovascular death compared to those who do not take a GLP-1
If 100 people take a GLP-1 for 2 years, 0.8 will avoid death compared to those who do not take a GLP-1
Evidence Source: Cochrane
Figures derived from a 2021 Cochrane review1 which included:
- 6 RCTs involving >44,000 patients
NICE did a review in 20222 with similar findings.
The Cochrane data has been used as it was presented in a more useful format.
References
1) Kanie T, Mizuno A, Takaoka Y et al. Dipeptidyl peptidase‐4 inhibitors, glucagon‐like peptide 1 receptor agonists and sodium‐glucose co‐transporter‐2 inhibitors for people with cardiovascular disease: a network meta‐analysis. Cochrane Database of Systematic Reviews 2021, Issue 10. Art. No.: CD013650
2) National Institute for Health and Care Excellence. Evidence review (B) underpinning recommendations 1.7.4-1.7.6 and 1.7.9-1.7.15 in: Type 2 diabetes Pharmacological therapies with cardiovascular and other benefits in people with type 2 diabetes. NICE; 2022 (NICE guideline [NG28])
Evidence Quality: HIGH
| This research provides a very good indication of the treatment effect.
However, it is possible that the true effect is slightly smaller or greater. |
Cochrane rated the evidence quality as HIGH for these two outcomes1:
- large RCTs at low risk of bias
- statistically significant findings with reasonable confidence intervals
- applicable to the population of people with T2DM and CVD
Reference
1) Kanie T, Mizuno A, Takaoka Y et al. Dipeptidyl peptidase‐4 inhibitors, glucagon‐like peptide 1 receptor agonists and sodium‐glucose co‐transporter‐2 inhibitors for people with cardiovascular disease: a network meta‐analysis. Cochrane Database of Systematic Reviews 2021, Issue 10. Art. No.: CD013650
Study Population
The population characteristics in the trials in the Cochrane review were roughly:
- mean age: early 60s
- 1/3 female
- ethnicity not reported, international multi-centre trials
- 4/5 of patients had pre-existing atherosclerotic CVD
- 1/5 of patients had pre-existing heart failure
- patients were taking a range of other glucose-lowering drugs
Reference
1) Kanie T, Mizuno A, Takaoka Y et al. Dipeptidyl peptidase‐4 inhibitors, glucagon‐like peptide 1 receptor agonists and sodium‐glucose co‐transporter‐2 inhibitors for people with cardiovascular disease: a network meta‐analysis. Cochrane Database of Systematic Reviews 2021, Issue 10. Art. No.: CD013650
Gastrointestinal side effects
6 in 100 people will experience abdominal pain, nausea, vomiting or diarrhoea due to treatment:
- 10.2% with GLP-1s v 4.4% with placebo in RCTs1
- this may be less likely if drug doses are titrated up slowly
Hypoglycaemia
GLP-1s alone do not cause hypoglycaemia, but may increase the risk when used in combination with insulin or sulphonylureas1.
Diabetic ketoacidosis
There have been case reports of DKA associated with the introduction of GLP-1s where existing insulin treatment was reduced rapidly or stopped2:
- The MHRA advise careful glucose monitoring, gradual reduction of insulin treatment, and advice to patients on the symptoms and signs of DKA 2.
Pancreatitis
Case reports and animal studies in the early 2000s gave rise to concerns about this as a possible rare harm of GLP-1s.
However, a high quality review of both observational and randomised evidence in 20143 (included 353,639 patients) concluded:
- ‘the available evidence suggests that … these drugs do not increase the risk of pancreatitis’
- however, they cautioned that this evidence was not definitive and could not exclude a very small risk
- BNF states “frequency not known”
References
1)Li S, Vandvik PO, Lytvyn L et al. SGLT-2 inhibitors or GLP-1 receptor agonists for adults with type 2 diabetes: a clinical practice guideline BMJ 2021; 373 :n1091
2)MHRA. GLP-1 receptor agonists: reports of diabetic ketoacidosis when concomitant insulin was rapidly reduced or discontinued. Drug Safety Update Volume 12, issue 11: June 2019: 2
3)Li L, Shen J, Bala M et al. Incretin treatment and risk of pancreatitis in patients with type 2 diabetes mellitus: systematic review and meta-analysis of randomised and non-randomised studies BMJ 2014; 348 :g2366
| Insulin | HbA1c reduction | Weight | Hypo risk |
| Approximate/average effect: | dose dependent | 4-6lb gain | High |
| Sulphonylureas | HbA1c reduction | Weight | Hypo risk |
| Approximate/average effect: | 11-22mmol/mol (1-2%) | 2-3lb gain | Moderate |
One major trial (UKPDS 33) compared diet plus either (or both) of these drugs to diet alone, over 10 years.
- The only outcome difference which reached statistical significance was a reduced need for retinal photocoagulation.
- Small differences in other microvascular endpoints added up to create a statistically significant reduction in combined microvascular endpoints.
- A (just) non-statistically significant reduction in non-fatal MI was observed, and is presented here because this outcome became statistically significant over longer term follow up.
Average HbA1c over 10 years in diet-only group: 63mmol/mol (7.9%)
Average HbA1c over 10 years in treatment group: 53mmol/mol (7.0%)
If 100 people take insulin or a sulphonylurea for 10 years, 2.7 will avoid the need for retinal photocoagulation compared to those not taking these drugs
If 100 people take insulin or a sulphonylurea for 10 years, 1.7 will avoid a non-fatal MI compared to those not taking these drugs
A small but non-statistically significant reduction in the rate of amputation was observed with drug treatment
A small but non-statistically significant reduction the rates of renal failure was observed with drug treatment.
A small but non-statistically significant reduction the rates of blindness in 1 eye was observed with drug treatment.
If 100 people take insulin or a sulphonylurea for 10 years, 2.4 will avoid a microvascular endpoint compared to those not taking these drugs
Evidence Source: single study
Figures derived from the UKPDS 33 trial1.
- 3041 patients with newly diagnosed diabetes
- compared diet plus either insulin or a sulphonylurea with diet alone
- a small proportion received both drugs
- follow up for a median of 10 years
Reference
1)UK Prospective Diabetes Study (UKPDS) Group. Intensive blood glucose control with sulphonylureas or insulin compared with conventional treatment and risk of complications in patients with type 2 diabetes (UKPDS 33). Lancet 1998; 352(9131): 837-853
Evidence Quality: LOW
| This research provides some indication of the treatment effect.
There is a high possibility that the true effect is smaller or greater. |
Though this was a large, well conducted randomised controlled trial1, there is some risk of bias:
- non-blinding of participants to treatment
- imprecise estimates of effect size (small numbers of events, wide confidence intervals)
Reference
1)UK Prospective Diabetes Study (UKPDS) Group. Intensive blood glucose control with sulphonylureas or insulin compared with conventional treatment and risk of complications in patients with type 2 diabetes (UKPDS 33). Lancet 1998; 352(9131): 837-853
Study Population
The study population in the UKPDS 33 trial1 were:
- mean age 53 years
- 39% female
- ethnicity: 81% Caucasian, Indian Asian 10%, Afro-Caribbean 8%, other 1%
- BMI 27.5
- SBP 135mmHg
- 31% Smokers
- HbA1c at start of study 7.1%
- TC/HDL ratio 5.0
- creatinine 81 mmol/L
Reference
1)UK Prospective Diabetes Study (UKPDS) Group. Intensive blood glucose control with sulphonylureas or insulin compared with conventional treatment and risk of complications in patients with type 2 diabetes (UKPDS 33). Lancet 1998; 352(9131): 837-853
Long-term follow up of UKPDS insulin/SU arm
Patients with newly diagnosed diabetes were randomised to tight control with insulin or sulphonylureas or diet alone.
After 10 years of follow up, the results shown in the main graphics were achieved1.
Then, patients were un-randomised and carried on with “usual care”, and were followed up for a further 10 years2.
- in this period, both groups achieved comparable glucose control
- 95% of patients eventually received oral therapy +/- insulin
At the end of this extended period, the two original groups were analysed separately.
Some new statistically significant differences in major endpoints were seen:
| Diet alone 10 years+
Usual care 10 years |
Diet+insulin/SU 10 years+
Usual care 10 years |
ARR | NNT(20y) | RRR | |
| Microvascular disease | 19.5% | 15.7% | 3.8% | 26 | 19% |
| Myocardial infarction | 28% | 24.8% | 3.2% | 31 | 11% |
| Total mortality | 52.8% | 44.4% | 4.6% | 22 | 11% |
Though this evidence is tricky to interpret directly due to the “half-randomised-half-not” design, it is often cited to support the benefits of tight glycaemic control and the idea of a “legacy effect” from early glycaemic control3.
- Note: here, “early glycaemic control” refers to the whole of the first 10 years rather than, say, the first 6 months after diagnosis.
References
1)UK Prospective Diabetes Study (UKPDS) Group. Intensive blood glucose control with sulphonylureas or insulin compared with conventional treatment and risk of complications in patients with type 2 diabetes (UKPDS 33). Lancet 1998; 352(9131): 837-853
2)Holman RR, Paul SK, Bethel MA et al. 10-Year follow-up of intensive glucose control in type 2 diabetes. N Engl J Med 2008; 359: 1577–1589
3)Chalmers J, Cooper M. UKPDS and the Legacy Effect. N Engl J Med 2008; 359: 1618-1620
Hypoglycaemia
Observational data on hypoglycaemia rates with gliclazide monotherapy:
0.24% people per year had a major hypo (requiring hospital admission) in this UK study1:
- observational study on UK GP-hospital database (LOW quality evidence)
- compared gliclazide monotherapy with metformin monotherapy
Hypoglycaemia rates over 10 years in UKPDS 33 trial2
| Minor | Major | |
| Sulphonylureas* | 14% | 0.5% |
| Insulin | 34.2% | 2.3% |
|
* Chlorpropamide and glibenclamide were used in this trial which ran over the 1980s and 90s Major hypoglycaemic episodes involve impaired conciousness and/or a need for assistance. |
||
- MODERATE quality evidence
References
1)Yu O, Azoulay L, Yin H et al. Sulfonylureas as initial treatment for type 2 diabetes and the risk of severe hypoglycemia. Am J Med 2017; 131(3): 317.e11-317.e22
2)UK Prospective Diabetes Study (UKPDS) Group. Intensive blood glucose control with sulphonylureas or insulin compared with conventional treatment and risk of complications in patients with type 2 diabetes (UKPDS 33). Lancet 1998; 352(9131): 837-853
| DPP4 inhibitors | HbA1c reduction | Weight | Hypo risk |
| Average/approximate effect: | 5-11 mmol/mol (0.5-1%) | None | No |
| Pioglitazone | HbA1c reduction | Weight | Hypo risk |
| Average/approximate effect: | 11 mol/mol (1%) | 2-6 lb gain | Low |
NICE recommends considering these two drugs as an option for glycaemic control after metformin and SGLT2is.
There is no clear evidence that they reduce micro- or macro-vascular complications of diabetes, though glycaemic control itself may confer these benefits over the long term.
DPP-4 inhibitors have a much better side effect profile than pioglitazone
DPP-4 inhibitors evidence summary – cardiovascular outcomes
more
Analyses by NICE3 and Cochrane4 found no reduction in cardiovascular events, heart failure or total mortality:
- included 6 trials involving >47,000 patients for up to 3 years
- compared DPP-4is to placebo (plus usual care)
- microvascular outcomes were not assessed
| HIGH quality evidence
This research provides a very good indication of the treatment effect. However, it is possible that the true effect is slightly smaller or greater. |
DPP-4 inhibitors evidence summary – harms
more
Acute pancreatitis
1 in 500 people may develop acute pancreatitis over 3 years of treatment4.
Otherwise DPP-4 inhibitors are well tolerated
- The Cochrane review found no increase in rates of hypoglycaemia, renal impairment or fracture associated with DPP-4i use4.
Pioglitazone evidence summary – cardiovascular outcomes
more
One medium-term trial compared pioglitazone with placebo (added to usual care) with respect to cardiovascular outcomes over 3 years1,2. It found:
- ~2% absolute reduction in acute coronary syndrome and angina, but
- ~3% absolute increase in heart failure
- ∼2% absolute increase in heart failure hospital admissions
- microvascular outcomes were not assessed
| MODERATE quality evidence
This research provides a good indication of the treatment effect. There is a moderate possibility that the true effect is smaller or greater. |
Pioglitazone evidence summary – harms
more
Hypoglycaemia
1 in 12 patients developed mild hypoglycaemia due to pioglitazone in combination with other glucose lowering drugs one RCT1.
Oedema
1 in 11 patients will get oedema due to pioglitazone treatment:
- 22% with pioglitazone v 13% with placebo over 3 years1
- mainly peripheral oedema
- case reports of macular oedema, frequency unknown
Heart failure
1 in 33 people will have an episode of heart failure due to pioglitazone treatment:
- 11% with pioglitazone v 8% with placebo over 3 years1
- thought to be due to fluid retention rather than ventricular dysfunction
Fractures
Fracture rates are increased in patients taking pioglitazone (and other thiazolidinediones). Estimates vary, but two examples are2:
- 5.8% of women taking thiazolidinediones v 3% of women on other glucose-lowering drugs (meta-analysis of RCTs)
- 28% relative increase in fractures in men and women taking thiazolidinediones compared with sulphonylureas (observational study)
Bladder cancer
- ∼27.5 excess cases of bladder cancer per 100,000 person-years in patients treated with pioglitazone for over a year
- derived from observational studies which vary regarding the exact risk increase5
References
more
1)Dormandy JA, Charbonnel B, Eckland DJ et al. Secondary prevention of macrovascular events in patients with type 2 diabetes in the PROactive Study (PROspective pioglitAzone Clinical Trial In macroVascular Events): a randomised controlled trial. Lancet 2005; 366(9493): 1279-1289
2)Richter B, Bandeira‐Echtler E, Bergerhoff K et al. Pioglitazone for type 2 diabetes mellitus. Cochrane Database of Systematic Reviews 2006, Issue 4. Art. No.: CD006060
3)National Institute for Health and Care Excellence. Evidence review (B) underpinning recommendations 1.7.4-1.7.6 and 1.7.9-1.7.15 in: Type 2 diabetes Pharmacological therapies with cardiovascular and other benefits in people with type 2 diabetes. NICE; 2022 (NICE guideline [NG28])
4)Kanie T, Mizuno A, Takaoka Y et al. Dipeptidyl peptidase‐4 inhibitors, glucagon‐like peptide 1 receptor agonists and sodium‐glucose co‐transporter‐2 inhibitors for people with cardiovascular disease: a network meta‐analysis. Cochrane Database of Systematic Reviews 2021, Issue 10. Art. No.: CD013650
5)FDA Drug Safety Communication: Update to ongoing safety review of Actos (pioglitazone) and increased risk of bladder cancer. 2011. Accessed online 25/1/23.
What is the value of lowering HbA1c for its own sake?
Let’s say someone is already being prescribed one or more glucose-lowering drugs with proven outcome benefits, lifestyle changes are being worked on, they’re on a statin and their BP is controlled.
How much actual benefit is there in lowering glucose further with more drugs which might not have proven outcome benefits?
It is clear that poor glycaemic control is harmful. But what is the absolute difference in benefit between “reasonably good” and “very good” control? This is one of the trickiest questions in diabetes management, because the evidence is unclear.
In a nutshell,
Possible benefits:
- RCT evidence shows some benefits of tight glycaemic control (these are small in absolute terms).
- Observational research provides more evidence of benefit (with all the usual caveats about observational data).
However,
- There may be a risk of serious harm (including death) due to hypoglycaemia from very intensive glucose lowering.
- Absolute benefits for an individual are likely to depend on their life expectancy and baseline risk of diabetes complications.
Grab a cup of coffee 😉 We’ve tried to make this as simple as possible, but it needs some reflection!
What can we learn from the RCT data?
more
The RCTs tell us what happens when we randomise to intense or less intense targets, by adding drug treatments.
They give us an idea of the “true” effect of drug treatment, but are not so good at detecting changes in rare outcomes or outcomes which take many years to develop (like blindness or end-stage renal disease).
The table below shows the headline findings of the major trials of intensive glucose lowering.
| Trial/year | UKPDS 34, 1998 | UKPDS 33, 1998 | ACCORD, 2008 | ADVANCE, 2008 | VADT, 2009 |
| Duration | 10 years | 10 years | 5 years | 3 1/2 years | 5 1/2 years |
| Drugs used | Metformin | Insulin/SU* | Wide range of drugs/strategies used | ||
| Duration of T2DMx | Newly diagnosed | approx 10 years established | |||
| Differences in average achieved HbA1cy.
mmol/mol % |
64 > 53
8.0% > 7.0% |
63 > 53
7.9% > 7.0% |
58 > 46
7.5% > 6.4% |
56 > 48
7.3% > 6.5% |
68 > 52
8.4% > 6.9% |
| Absolute risk reduction in: | 6.4% Myocardial infarction
7% total mortality |
1.4% Non-fatal MI
3.3% retinal photocoagulation |
1% Non-fatal MI
1% 3-line reduction in visual acuity |
1.1% Renal outcomes
(new albuminuria, doubling of creatinine, renal replacement therapy) |
none |
| No statistically significant reduction in: | Blindness in 1 eye
Amputations Neuropathy End stage renal disease |
CV or total mortality
Blindness in 1 eye Amputations Neuropathy End stage renal disease |
Blindness in 1 eye
Amputations Neuropathy End stage renal disease |
CV or total mortality
Blindness in 1 eye Amputations Neuropathy
|
NFMI
CV or total mortality Blindness in 1 eye Amputations Neuropathy End stage renal disease |
| Absolute risk increase in: | none | none | 0.8% Cardiovascular mortality
1% Total mortality |
none |
none
|
| Minorz
hypoglycaemia (absolute risk increase over trial duration) |
0.4% | Insulin: 35%
SU: 14% |
Not reported | 15% | 16% |
| Majorz
hypoglycaemia (absolute risk increase over trial duration) |
0 | Insulin: 2%
SU: 0.5% |
11% | 1.2% | 5% |
*SU, sulphonylureas; x duration of T2DM at start of trial; y average differences in HbA1c control between the two treatment arms over the course of the trial; z definitions of major or minor hyperglycaemia are varied or not reported in trials. A reasonable assumption/guide might be that “major” episodes involve impaired consciousness and/or a need for assistance.
Summary
With the exception of UKPDS 34 (metformin), these RCTs show either no, or relatively small absolute benefits on important outcomes.
- Prevention of non-fatal MI and markers of retinopathy progression seem to be the commonest benefits.
One trial suggests increased mortality from very tight control to HbA1c 46mmol/mol (6.4%).
- This may be due to more use of insulin in this trial.
Limitations
In the trial populations, major microvascular endpoints like blindness, end-stage renal disease and amputations were fairly rare (even the control groups had moderately good glycaemic control). In a higher risk population we might see more benefit.
The RCTs don’t tell us anything about the difference between “bad” and “moderate” glycaemic control, they were testing what might be termed “good” v “tight” control.
The RCTs are time limited – more benefit may accrue over more years.
What can we learn from observational data?
more
Observational studies can give access to more data over longer time periods, so may be able to detect changes in rarer outcomes, or those which take longer to develop than the duration of an RCT.
However, they don’t measure the “true” effect of drug treatment because of a lack of randomisation. The people achieving lower HbA1c may be doing this by better dietary adherence for example. Also, better outcomes might be due to unmeasurable individual factors rather than drug treatment: “residual confounders”.
Many observational studies show a relationship between lower HbA1c and better outcomes.
How does this translate in absolute terms? What is the size of this benefit?
These graphs will give you some idea (hover your mouse to see the numbers):
A: Clinical outcomes over 10 years in newly diagnosed diabetes. Data from 1977-1998, UK

The same trend is seen in both studies, but in the UK data (graph A) which is older, the background rates of cardiovascular disease and mortality are higher, reflecting standards of care at the time.
Note that the risk differences between various HbA1c levels are greater the higher up the scale you go.
- There is a greater absolute risk difference between, say, HbA1c 102 and 91mmol/mol than between HbA1c 58 and 48mmol/mol.
Limitations
Observational data doesn’t tell us the effect of a particular drug. Some drugs used in these studies had RCT-proven benefits, and some of those achieving low HbA1cs will have done this via dietary control. There may be unmeasured factors other than treatment strategy which affect outcomes.
All of this data is very approximate, with frequently overlapping confidence intervals.
The populations which were studied are not directly applicable to a current UK population so should be interpreted with caution.
Data detail
Graph A is taken from the observational study of the UKPDS trial6. The randomised study results are shown in the dedicated metformin and insulin/SU sections. For this observational study, the results from all patients in the trial were merged to explore the relationship between different achieved levels of HbA1c and outcomes. The HbA1c value here was the average over the 10-year course of the study.
They were modelled on a white male age 50-54, SBP 135mmHg, SeCr 80mmol/L, no albuminuria, TC:HDL ratio 5
Graph B is derived from a risk scoring system derived from individual patient data from the ACCORD trial3,7. The unrandomised results from all patients in the trial were used to explore the relationship between different achieved levels of HbA1c and outcomes. The HbA1c value here was the average over the 4.7-year course of the study. These were then modelled to produce 10-year predicted complication rates10.
For comparability to the UKPDS data, we have used the same variables as above (white male aged 50-54, SBP 135mmHg, SeCr 80mmol/L, no albuminuria, TC:HDL ratio 5).
What about harms from low glycaemic targets?
more
There is some evidence that aggressive lowering of glucose increases the risk of death (presumed to be related to hypoglycaemia). This is sometimes referred to as the “J-shaped curve”.
In one RCT, ACCORD3, a 1% absolute risk increase in cardiovascular mortality was found with tight glycaemic control (average HbA1c of 46mmol/mol, 6.4%). This may have been related to higher use of insulin in this trial.
An observational study using UK GP data, showed an increase in mortality at HbA1c below about 58mmol/mol (7.5%) in patients who had their drug treatments intensified compared to those who did not. This was more apparent when insulin-based regimens were used:
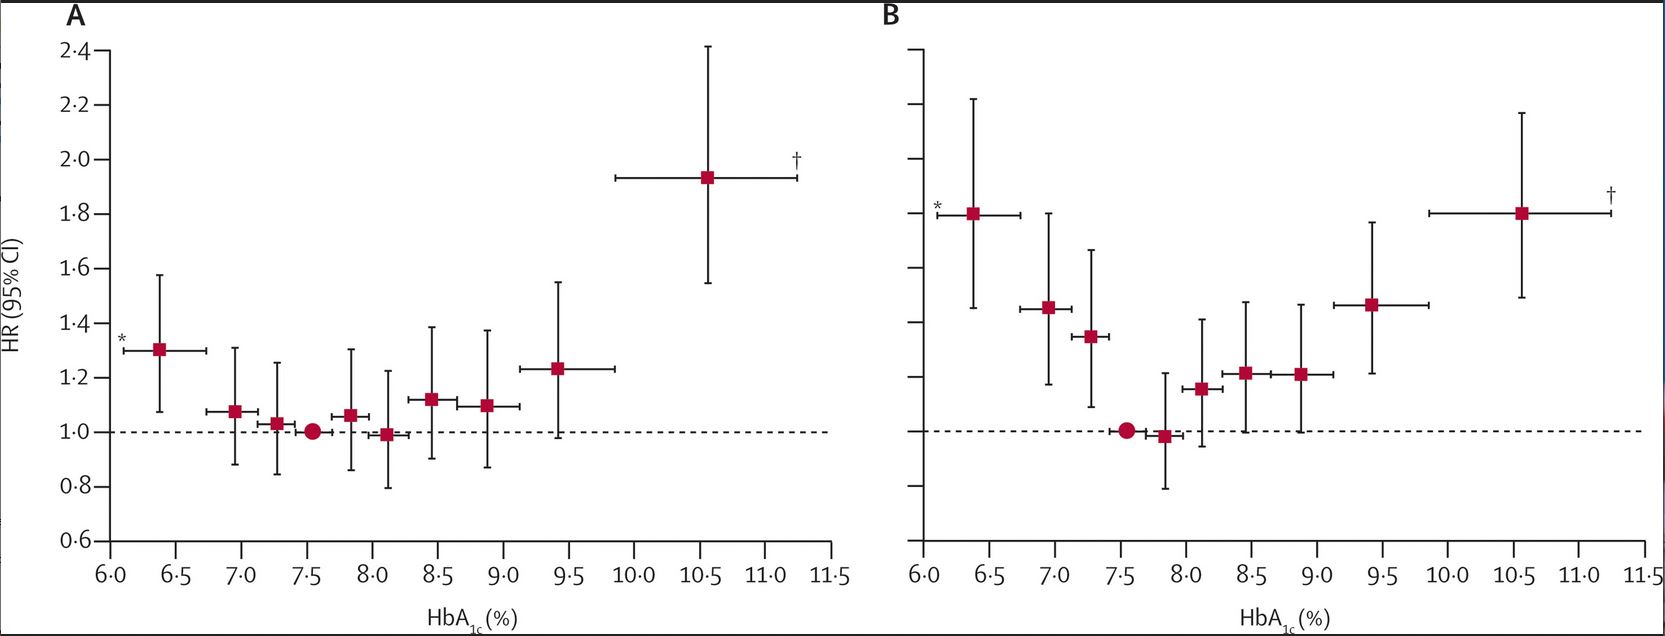
|
Risk of total mortality in relation to mean HbA1c over 4 years in those treated with (A) metformin and sulphonylureas (B) insulin-based regimens, compared to patients without intensification of drug treatment. |
|
HR, hazard ratio for total mortality compared to patients without intensification of drug treatment where HR = 1.0 Reproduced with permission from Currie et al. The Lancet, 2010 9 |
How can we think about setting glycaemic targets? What does NICE recommend?
more
NICE recommends discussing and agreeing an HbA1c target with individuals8. They have produced a patient decision aid to support these discussions.
NICE also suggests 2 specific targets alongside this.
First, let’s look at the 2 specific targets and what might be behind them:
1)Where someone’s T2DM is being managed by diet alone, or by diet and a single drug not associated with hypoglycaemia, support them to aim for:
- HbA1c 48mmol/mol (6.5%)
2) Where someone’s T2DM is being managed with a drug associated with hypoglycaemia, support them to aim for:
- HbA1c 53mmol/mol (7.0%)
When to intensify treatment?
If HbA1c levels rise to 58mmol/mol (7.5%) on a single drug, support them to aim for a target of 53mmol/mol (7.0%) by diet or lifestyle measures or intensifying drug treatment.
What’s the thinking behind these targets?
These targets represent a view which places value on “best possible” glycaemic control, based on the benefits we are able to see from RCTs and assuming the benefits seen in the observational evidence are generally applicable.
They also try to take into account potential harm from hypoglycaemia at lower targets as well as drug treatment burden.
What about individualising targets?
NICE suggest to consider relaxing the HbA1c target on a case by case basis in discussion with the individual, with particular consideration for those who are older or frailer. Suggested things to consider are:
- shorter life expectancy meaning someone might be unlikely to achieve long-term risk-reduction benefits
- what is meant by shorter life expectancy is not specified
- a helpful way to consider this might be to look at the absolute risk reductions seen over various periods of time in the RCTs and observational data above and think about how that might apply to your patient
- risk and consequences of hypoglycaemia (e.g., falls risk, impaired hypo awareness, risky occupations)
- number of co-morbidities and treatment burden
What those more relaxed targets might be is not specified.
You can see from the data in this section that there is not an obvious cut-off point where benefits change.
This area will test your person-centred, evidence-based practice perhaps more than any other … !
References
more
1)Effect of intensive blood-glucose control with metformin on complications in overweight patients with type 2 diabetes (UKPDS 34). Lancet 1998; 352(9131): 854-865
2)UK Prospective Diabetes Study (UKPDS) Group. Intensive blood glucose control with sulphonylureas or insulin compared with conventional treatment and risk of complications in patients with type 2 diabetes (UKPDS 33). Lancet 1998; 352(9131): 837-853
3)ACCORD study group. Effects of Intensive Blood-Pressure Control in Type 2 Diabetes Mellitus. N Engl J Med 2010; 362: 1575-1585
4)ADVANCE Collaborative. Intensive Blood Glucose Control and Vascular Outcomes in Patients with Type 2 Diabetes. N Engl J Med 2008; 358: 2560-2572
5)Duckworth W, Abrarira C, Moritz T et al. Glucose Control and Vascular Complications in Veterans with Type 2 Diabetes. N Engl J Med 2009; 360: 129-139
6)Adler AI, Stratton IM, Neil HA et al. Association of systolic blood pressure with macrovascular and microvascular complications of type 2 diabetes (UKPDS 36): prospective observational study. BMJ 2000; 321(7258): 412-419
7)Basu S, Sussman JB, Berkowitz SA et al. Development and validation of Risk Equations for Complications Of type 2 Diabetes (RECODe) using individual participant data from randomised trials. Lancet Diabetes Endocrinol 2017; 5(10): 788-798
8)National Institute for Health and Care Excellence. Type 2 diabetes in adults: management. 2015 [Internet]. [London]: NICE; 2015 [updated June 2022]. (NICE guideline [NG28])
9)Currie CJ, Peters JR, Tynan A et al. Survival as a function of HbA(1c) in people with type 2 diabetes: a retrospective cohort study. Lancet 2010; 375(9713): 481-489
10) Personal communication. Prof. James McCormack, University of British Columbia. The modelling tool which produced these figures will be published shortly and linked to here when available. Written Jan 2023.
Key
People who have an adverse event
People whose adverse event is prevented by treatment
People who were never going to have an adverse event anyway
Graphics and NNTs are rounded to the nearest integer
Stats explained
These three statistical terms offer three different ways of looking at the results of trial data.
ARR
Absolute Risk Reduction
This tells you how many people out of 100 who take a treatment have an adverse event prevented.
MoreThe value of the ARR changes with the baseline risk of the person (or population) taking the treatment. The higher the starting risk, the greater the absolute chance of benefit.
You need to think about over what time the trial data show this benefit, as it is usually assumed that more absolute risk reduction is gained over time.
Your patient might be taking the treatment for much longer than the length of a clinical trial (or, if life expectancy is limited, perhaps for less time).
NNT
Number Needed to Treat
This tells you how many people need to take the treatment in order for one person to avoid an adverse event.
The lower the number, the more effective the treatment.
MoreThe value of the NNT changes with the baseline risk of the person (or population) taking the treatment. The higher the starting risk, the smaller the NNT.
You need to think about over what time the trial data show benefit, as it is usually assumed that more benefit is gained over time and therefore the NNT will drop over time.
Your patient might be taking the treatment for much longer than the length of a clinical trial (or, if life expectancy is limited, perhaps for less time).
RRR
Relative Risk Reduction
This tells you the proportion of adverse events that are avoided if the entire population at risk is treated.
MoreThe value of the RRR is usually constant in people (or populations) at varying degrees of risk.
It is also usually assumed to stay constant over time.
This can be helpful, especially when thinking about population outcomes, but can be misleading for an individual person:
For example, a RRR of 25% in someone with a baseline risk of 40% would give them an ARR of 10% and an NNT of 10.
A RRR of 25% in someone with a baseline risk of 4% would give them an ARR or 1% and an NNT of 100.